Wednesday, December 22, 2010

Final Blog Post EDUC6713

Technology is an ever changing field. Teachers, by definition, support the pursuit of knowledge. Those teachers who are passionate about technology have found an endless source of topics to research. But this research needs to be systematic.

In some of the initial posts, some of my colleagues noted that they keep a list of technologies they plan on researching. I felt bad that I was not that organized. If someone sends me a link or tells me of a new technology, I bookmark it in Delicious, but only get back to it when I think I can incorporate it into practice.

I think in using the ideas from my colleagues and the GAME plan together, I now feel I have the tools to systematically pursue new technologies. I think I need to keep a more organized list of topics to research, align them to the NETS for teachers and rather than researching them at the 11th hour, always have one in the GAME process.

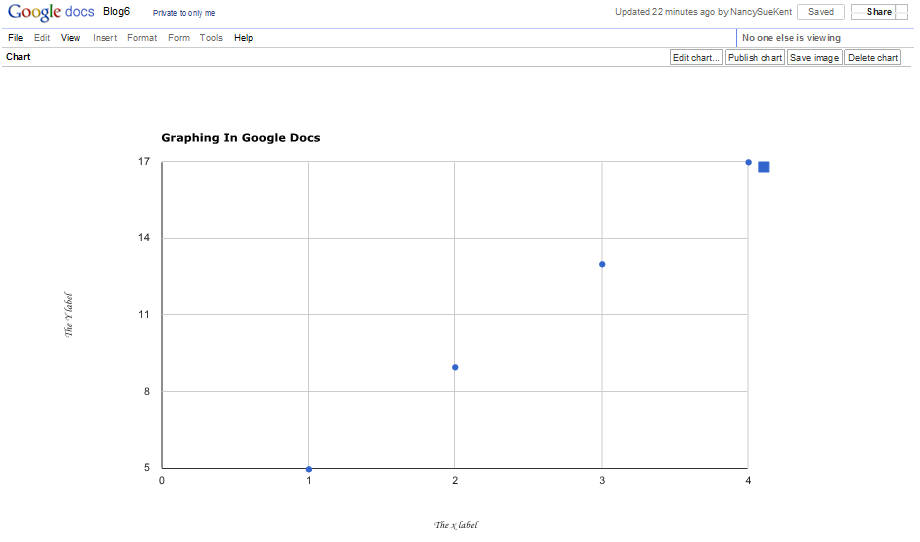
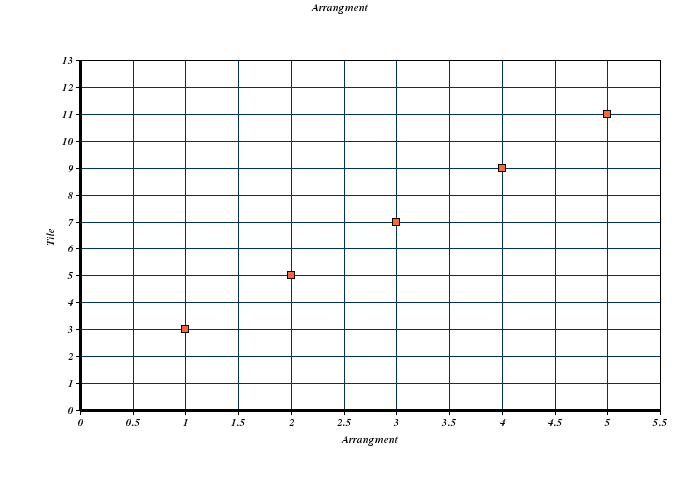
I am pleased with the results of the GAME plan I developed for this course: finding free online tools my students can use from home to help them process data for their 10 journal assignments in my Algebra classes.

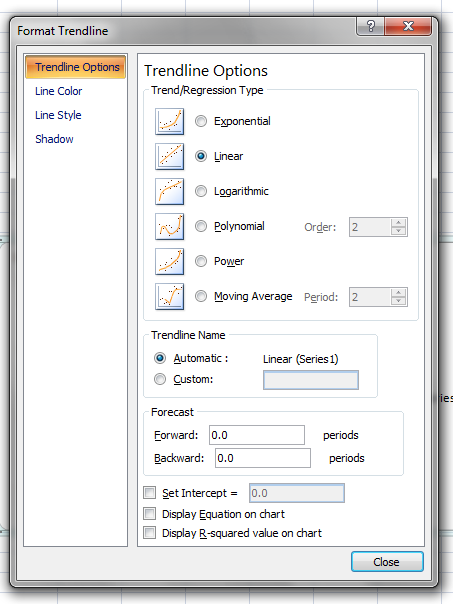
I learned that there is no free online tool that duplicates the power of Excel or the Texas Instruments graphing calculators that we have access to in the classroom, but it does appear they may be some on the horizon. MashUp and Microsoft Fuse Labs are already on my GAME list to keep checking on. In the meantime, my students can use two tools to accomplish the task.

Our high school operates on a 4x4 block so I will have new Algebra courses beginning in January. I can immediately educate my students on these new tools so they will have access to data analysis tools in the classroom and at home; giving them the ability to be independent learners.

Monday, December 13, 2010

Using the GAME Plan with Students


The GAME plan is a straightforward systematic approach for
technology goal setting. I believe I could use it effectively with the technology my students need specifically for my course; like analyzing data, but I don’t feel a school can adequately educate the entire population in the ISTE NET-S without administrative leadership

I serve on our district technology committee; we have 3 elementary schools, 1 middle school, 1 high school and 1 vocational school. We have analyzed the ISTE standards, our state standards and organized them into district standards. Our biggest concern was that students coming through our program can have inconsistent exposure to technology. A student might be lucky enough to get teachers who are passionate about technology integration or unlucky and never have the opportunity to use technology. For teachers, it is really an issue of time. As a committee we wanted to organize best practices per grade level put them on a central server so teachers did not have to re-invent the wheel. For example, all fifth graders study the history of our town. We were willing to organize a folder with digital images so all teachers could access it. We were very excited to take on this project!

We went to the Assistant Superintendent/Curriculum Coordinator and she said we had to focus all our attention on our NCLB initiatives in Math and English, and so our project died.

Until a district wide systematic approach is supported by the administration at the top, where a student can create a GAME Plan that spans grade levels organized into an e-portfolio, I feel like I am just contributing to these inconsistencies. Our school needs to embrace the ISTE process and set the essential conditions to educate our students:

http://www.iste.org/standards/nets-for-students/nets-for-students-essential-conditions.aspx


Perhaps when colleges start requesting links to students work, it will get more attention. I do what I can, I try to invite teachers to partner with my class when I am doing a lesson I have created at Walden University, promoting change one teacher at a time. It is usually the first time other teachers have been introduced to the ISTE standards.


To catch a few students, I can start having my students create several GAME plans over my 18 week course. I could present the NET-S to them at the beginning of the course; which most have never seen.

GOAL: For a long term Goal, they could decide how they would like to use technology to complete their 10 journal assignments: learning the graphing calculator, Excel or the free online spreadsheet, Google Dcos, I used for my game plan.

ACTION: They could pursue one choice for two journals.

MONITOR: They could analyze their comfort level, access and results and see if they would like to switch to another method for the next two journals.

EVALUATE: They could evaluate if they are happy with the product they choose.

This would model the process for them. Then when we have a class activity that aligns to a NET-S, they could complete another GAME process.
It is my hope that ISTE will help schools formally develop a process to help schools:

http://nets-implementation.iste.wikispaces.net/

They have a survey online asking what resources teachers think would be helpful:

NETS for Students Development Rubric (by grade)
NETS for Students Assessment Rubric
NETS for Teachers Comprehensive Rubric
NETS Scope and Sequence
NETS Learning Objectives (by grade)
NETS Curriculum Mapping
NETS Observation Check List
Implementation Videos
NETS-aligned Lesson Plans
Rubric for Evaluating Lesson Plans
Peer-reviewed Process for NETS-aligned Lesson Plans
Content-area Experts to Infuse NETS
NETS Toolkit for District Use
Database of NETS-Aligned Activities

I look forward to when they are available!

Tuesday, December 7, 2010

Results of GAME Plan – Piecing it Together


After an exhaustive search, I am now ready to recommend the best tools for my students to help complete their data analysis for their journal questions if they do not have Excel at home. It requires piecing together two tools. This is meant to be a step by step tutorial to create and print graphs for my student; please click on each image to enlarge.


The first tool, Google Docs: docs.google.com

I selected Google Docs because it does not require any downloads to the student’s home computer; all you need is a Google Account.


To analyze data: Go to Create New Spreadsheet

X   Y
1    5
2    9
3   13
4   17

Steps
1) Enter data and select the data (it will turn blue)
2) On toolbar, select Insert Chart
3) In CHARTS - Choose Scatter AND click on the graph image
4) Select INSERT button on the lower right.


5) But this will embed the graph in your data. Use the pull down menu to move it to its own sheet


6) Go to Edit Chart to add titles and labels
7) Add a title
8) Add a label for the Vertical Axis and Change Min and Max if necessary
9) Switch to the Horizontal Axis and repeat
10) Choose Update when complete


PRINTING
Now it would seem that printing would be easy….but
11) Using FILE print produces a blank page
12) Publishing gives you a URL to embed on a web page
13) Save Image is a Quick Time File


14) Instead right click in the graph area and SELECT ALL


15) Right click again when all is blue and Select Print Preview


16) At this point, you will be in the browsers’ menu. Set the orientation to Landscape if necessary
17) Select the print icon


Your Graph:


TRENDLINEAt this point you have a beautiful graph printed on its own page complete with title and labels. But you have not been able to find the equation of the line.

The second tool: A Simple Regression Utility at

http://people.hofstra.edu/Stefan_Waner/RealWorld/newgraph/regressionframes.html

by Stefan Waner and Steven Costenoble from Hofstra University.

18) Re-enter the data


19) Select the appropriate type of regression

20) Find the Trendline here


There you have it, in 20 easy steps!

I have learned that there is no single free online tool to accomplish the task we can in the computer lab. My goal now will be to continue to research until I can find a more streamline free approach.

My new learning goals will be explore the web site:

http://nets-implementation.iste.wikispaces.net/

to have a more systematic approach to linking all the NETS in my curriculum and to try and find a free online course management systems like Moodle to use with my spring semester computer programming course. I plan on using the GAME plan again and have already started my KWL chart.

Monday, November 29, 2010

Evaluating GAME Progress

Royalty Free Image from www.123rf.com

This week I finished reviewing my last 5 free online spreadsheets. EXpressoCorp was no longer available for new accounts as it will soon be integrated into Lotus Live, which will be a subscription service. InputWebWizard is not free, Peepel looks promising, but will not open. Sheetster was very buggy, the graph window appeared, but did not contain the graph. SimpleSpreadsheet only offered source code. Now I have reached my 20th spreadsheet to evaluate: ThinkFree. Despite its name, ThinkFree is not free. It is still in beta and may be one to watch as it has many of the features I am looking for based on my free 30 day trial evaluation.

My conclusion, at present there is no free online spreadsheet that can rival Excel or the Texas Instruments Graphing Calculator for data analysis.

I am not giving up. It appears there are many online applications in beta like MashUp and Microsoft Fuse Labs which is designed to share Docs on Facebook

http://docs.com/

that may be available soon.

For my refocused GAME plan:

1) Locate a web based graphing program or calculator that can print professional looking full page graphs. I researched all graphing tools at Cool Tools for Schools

http://cooltoolsforschools.wikispaces.com/Graphing+Tools

and found two can make nice xyscatter: ChartTool and ChartGizmo, but they only have auto scaling and will not connect the ordered pairs.


2) Locate a web based site that will calculate the 5 types of regression equation my students are expected to perform. The best one I have found so far is at:

http://people.hofstra.edu/Stefan_Waner/RealWorld/newgraph/regressionframes.html

Still searching…..In the “Looking for a Needle in the Haystack” division, I also searched and downloaded multiple freeware and shareware products: MATHGV4, SPR, Kalkulator, Statiscope, SHAZAM, Graph-Free Graph Plotting Software, Sagata Regression Pro 1, and ZGrapher 1.4

and located more (unusable) online options:

http://www.mathcracker.com/scatter_plot.php
http://www.socr.ucla.edu/htmls/SOCR_Charts.html
http://www.statcrunch.com/5.0/googlemap.php
http://www.swivel.com/
http://www.wessa.net/slr.wasp
http://web2.0calc.com/

I did find www.calculator.com has a statistics view coming soon – another technology to watch.

Late to this entry, I have discovered Google Just announced new tools new Chart tools which I will investigate next week.

http://www.freetech4teachers.com/2010/10/new-visualization-charts-in-google-docs.html

Tuesday, November 23, 2010

Monitoring the GAME Plan


I use a Texas Instruments Graphing Calculator and Excel in my classroom. In my game plan, I want to find a comparative free data analysis tool for my students to use at home for 5 types of regression. I have finished compiling a list of 20 free online spreadsheets and began to evaluate the features my students would need.


Royalty Free Image from www.123rf.com

For each, I created a free account and copied in 5 data sets. I used the help features to learn how to create an xyscatter graph for each and then looked for the 5 corresponding trendlines. If there was no trendline option, I looked for built in functions. Then I looked at the quality of the graph and how it would look printed. Could it be enlarged and printed on its own page or did it have to be on top of the data within the sheet? I finally looked for export options.

After evaluating 15 online spreadsheets I have found 8 were not going to be useful. They were either no longer available or only offered the source code to be downloaded. The user would have to compile it and this is far too complicated for my target audience. The other 7 sites had varying useful features (see matrix below), but none that exactly duplicated the abilities of the tools we use in class.

Here is my evaluation matrix so far:


I was most disappointed with Office Live. It does not have any of the Trendline features that Excel does, lagging far behind even Open Office which can at least do linear and exponential trendlines. I did learn Microsoft is going to be releasing a based web application called Microsoft Cloud Office 365, but was again disappointed that will be subscription based.

I still have 5 more to evaluate, but I fear the more obscure they are, the less likely they will have multiple features. They are eXpressoCorp, InputWebWizard, Peepel, Sheetster, SimpleSpreadsheet and ThinkFree.

I do not feel I am finding the information and resources I need.

I do feel I need to modify my GAME plan.

My new focus will be a two part search:

1) To locate a web based graphing programs or calculators that can print professional looking full page graphs. I have found a good starting point for researching graphing tools:

http://cooltoolsforschools.wikispaces.com/Graphing+Tools

2) To locate a web based site that will calculate the 5 types of regression equation my students are expected to perform. I have found two so far:

http://people.hofstra.edu/Stefan_Waner/RealWorld/newgraph/regressionframes.html

http://www.xuru.org/rt/TOC.asp
and will continue searching site from:

http://statpages.org/#Calculators

Monday, November 15, 2010

Carrying Out the Game Plan


Royalty Free Image from www.123rf.com


My research first revealed that spreadsheets were usually a component of an Office Suite as opposed to a standalone application. I organized this information into a hierarchy. Next I began by classifying the different types of spreadsheets that students could use and made the following Concept Map.


To test each spreadsheet, I generated 5 sets of data to import into each one to test the 5 types of Trend line regressions I usually ask my students to do: Linear, Quadratic, Polynomial, Exponential with an integer base and Exponential with e (2.718) base. In class we usually use Excel or a Texas Instruments (TI) calculator (which does not have a print feature). I made a list of what features students would need if they were working from home: make and print a graph, print data chart and export to Excel. I organized this information into a matrix to compare to our classroom based options. There will be an additional column for each site I locate. Currently the list is: Google Docs, Open Office – Calc, Zoho, EditGrid, Microsoft Cloud, KOffice, ZCubes and Google Wave.


I have already eliminated Gnome as an option as it was open source and geared more toward developers. I have two more sites to research that could add to the list I have found so far

http://www.editgrid.com/user/siulung/Web-based_Spreadsheets_Comparison_Matrix

and

http://mashable.com/2008/02/06/forget-excel-14-online-spreadsheet-applications/

By now I realized my research was going in 3 directions

1) Classifying spreadsheets: web based, downloadable or cost which I also want to further subcategorize by real time/collaborative. (1st Concept Map)

2) Site Research sites, make accounts at each and test 5 data sets by trendline. (I am concerned I am getting too many)

3) If a spreadsheet did not have trendline feature, researching if there were built-in functions to build the trendline by graph quality or if you had to manually enter each formula:


I was starting to get overwhelmed, so I started a journal to organize my progress each day and prioritize my time. Although I would like to know 100% of everything, I think I need to limit my direction in two areas.

If I continue to add new sites, like the ones from the above 2 web sites, I would have 24 sites to test. I guess I only need to research until I find the one that meets my students’ needs. My students at this point only need to know if the Trendline option if available, so although it is useful for me to know about built in functions and manual calculations, I will limit my time in this area, possible organizing it into a different comparative matrix.

My goals for this week are to finish compiling my list of spreadsheets, classifying them on the 1st concept map as I go in and make an account for each. Then begin testing my data sets.

Accessing Trendline Option:


Trendline Choices:

Sunday, November 7, 2010

EDUC 6713: Personal Game Plan


RF image license:
www.featurepics.com/online/Football-Game-Strategy-1660216.aspx

With so much technolgoy to explore which could enhance my content, breaking it down in a GAME plan will make it more manageable.

A GAME Plan is a four step process:
G = Set Goals
A = Take Action
M = Monitor Progress
E = Evaluate and Extend (Cennamo, 2009)

The International Society for Technology Education has compiled a list of both Student and Teacher Standards. All of them are important, but for this GAME plan, I will concentrate on my students being able to do NETS - S

2.Communication and Collaboration
Students use digital media and environments to communicate and work collaboratively, including at a distance, to support individual learning and contribute to the learning of others.
Students:
a. interact, collaborate, and publish with peers, experts, or others employing a variety of digital environments and media.
d. contribute to project teams to produce original works or solve problems.

4.Critical Thinking, Problem Solving, and Decision Making
Students use critical thinking skills to plan and conduct research, manage projects, solve problems, and make informed decisions using appropriate digital tools and resources.
Students:
c.collect and analyze data to identify solutions and/or make informed decisions.

So I need to set goals with NETS - T:

1. Facilitate and Inspire Student Learning and Creativity
Teachers use their knowledge of subject matter, teaching and learning, and technology to facilitate experiences that advance student learning, creativity, and innovation in both face-to-face and virtual environments.
Teachers:
b.engage students in exploring real-world issues and solving authentic problems using digital tools and resources.
d.model collaborative knowledge construction by engaging in learning with students, colleagues, and others in face-to-face and virtual environments.

2. Design and Develop Digital-Age Learning Experiences and Assessments
Teachers design, develop, and evaluate authentic learning experiences and assessment incorporating contemporary tools and resources to maximize content learning in context and to develop the knowledge, skills, and attitudes identified in the NETS•S.
Teachers:
a.design or adapt relevant learning experiences that incorporate digital tools and resources to promote student learning and creativity.
c.customize and personalize learning activities to address students' diverse learning styles, working strategies, and abilities using digital tools and resources.

Goal: To analyze how my students could best use spreadsheets as a mindtool. I want my students to be able to organize, manipulate, represent, reflect and build knowledge by seeing data in all forms as the NCTM recommends in both individual and collaborative environments.


To achieve this, I will brainstorm sites from colleagues and from online research and evaluate each viable tool.


I will monitor my progress by completing a descriptive matrix of important qualities for each of the courses I teach.


I will evaluate and extend my learning by designing lessons and asking students to
experiment with the tool to see if it meets their needs.


References:
Cennamo, K. R. (2009). Technology Integration for Meaningful Classroom Use: A Standards-Based Approach (Laureate Education, Inc., Custom ed.). Belmont, CA: Wadsworth: Cengage Learning.

International Society for Technology Education. (2010). Retrieved November 2, 2010, from Student NETS: http://www.iste.org/standards/nets-for-students.aspx
Laureate Education, Inc. (2009). Integrating Technology Across the Curriculum: Enriching Content Area with Technology, Parts 1 and 2.

National Council of Teachers of Mathematics (NCTM). (2010) Retrieved November 7, 2010, from http://www.nctm.org

Wednesday, June 23, 2010

Walden Course Reflection Educ 6712

I am 70% of the way through an educational master’s degree at Walden University in Integrating Technology into the Curriculum. This week we were asked to respond to David Warlick’s comment that it is not about the technology: http://davidwarlick.com/2cents/?p=1587. What??? That was the specialization area I chose!

As I reflect back over this course and my six other Walden courses, I realized Walden has been integrating current technologies with solid educational practices. Given the speed with which technology changes, this makes sense. The technologies that are available today may not be what schools are using in five years. What we need to impart on our students are the skills to be successful in the 21st century work environment; which is inconceivable today.

I had always intended to get my master’s degree soon after my undergraduate degree. But time has flown by and now I have been teaching for over 20 years. I am thankful I have the opportunity through Walden to analyze how technology and pedagogy complement each other, especially in a time of such rapid technological change. As David Thornburg stated:

“Given current technology, how should classroom practice change?”

“Given current classroom practice, how should technology change?”


In this course, we took a researchable topic from our content area and built a lesson plan that linked the concept to informational literacy using the Quest Model. (Eagleton and Dobler) As the author’s suggested, I created a reenactment using an online comic creator: Pikikids at http://www.pikikids.com/


http://pikikids.psh.piki-fun.com/comic_strip/s/image/34/381/113/comic-p.jpg

The most striking realization I had in this process, was that my math topic was irrelevant; this lesson plan is transferrable to any new topic or even content area. I can adjust this lesson or share it with peers by changing only the “Content” page. I also realized that this plan is not tied to any one technology, so as technology changes, this plan will only need minor revisions. This is because the QUEST model is based on information literacy skills, not an individual technology. With so much information on the web, this unit teaches students how to find useful and truthful information.

I think the biggest mistake I have made as a teacher in using technology based projects is moving right to the product. As I created this lesson plan, I had fifteen assignments before the product phase (T = Transform) began.

The biggest knowledge I gained was a plan to scaffold the assignments. I always knew my responsibility for student learning extended beyond the mathematical content area. My rubric always accounted for the ability to function in a group setting, but this framework accesses a students’ ability to manage the information on the internet and make a meaningful product based on the synthesis of the information from multiple sites/sources.

My first goal will be to try out this unit next school year. Then I will continue to look for other units where the QUEST model will apply. I also hope to engage my department in contributing to the National Math Trail. I presented it at our last department meeting and people were interested!

Eagleton, M. B., & Dobler, E. (2007). Reading the web: Strategies for internet inquiry. New York: The Guilford Press. Resources available at http://readingtheweb.net/

Thornburg, David. (2004). Technology and Education: Expectations, not Options. Retrieved June 23, 2010 from http://www.tcpdpodcast.org/briefings/expectations.pdf

Saturday, May 22, 2010

Over 50 Questions to ask when Validating a web page

At first I thought evaluating a web search and web page was no big deal, just check a few things. When I started to brainstorm, I found I had a list of over 50 questions to ask to determine if a web page contains useful and truthful information.

The Process:
1)Evaluating your web search list to decide which links to follow
2)After selecting a hit, evaluating if this information is useful to your theme and focus and if it is
3)Determining the validity of the web site

Step 1 - Which Links to Follow

Looking at the list
•Order of the list – does being first mean it is the best?
•Are they sponsored Links?

Domain Names – how do you Read a URL’s
•The URL is a Universal Resource Locator which masks an IP address
www.componentDomainName.TopLevelDomain or www.subdomain.microsoft.com
•What is the TopLevelDomain or extension http://en.wikipedia.org/wiki/List_of_Internet_top-level_domains
The most common to expose children to are: .org .edu .com .k12. gov
•What Protocol – is it www or http?
•Check the Paths and directories
•Are your keywords in the URL?
•Is it a personal page? Does it contain: ~, %, or words like: aol, users, members, or people?

•Web page description Reading the paragraph under, does it provide categories?

•Before going to Plan B - Have you tried different search engine and/or keywords?

Step 2 - Would this information useful to your theme and focus?
Home page
•Is there a welcoming paragraph?
•Does it convey purpose of site?

Is it user friendly – can you find information as you navigate the site?
•Does it have an electronic table to contents?
•Does it have a site map or image map?
•Is there a logo to help you get back to the home page?
•Does each page have a title?

Links
•Are the links Current? Reputable?
•If you navigate into the web site, can you get back?
•Does a Logo bring you back to the home page?
•Is there a bread crump trail of links to help you navigate?

Is there multimedia?
•Is it informational: Videos or animations?
•Is it annoying: flashing banners, distracting animations or sounds, annoying colors? Pop Up ads

Step 3 - Validating Content - Is the information true?
1.Authority
•Who is the Author/Publisher – can you contact them? What are their Credentials?
•http://whois.domaintools.com/zapatopi.net
•Yahoo Answers: Popularity ≠ Quality
•Can the content be verified on another site?
•Does the content make sense? Could this be a bogus site?

2.What is the Purpose of web page

3.Objectivity
•Does the author provide information you don’t agree with or you think is wrong?
•Are there Stereotypes, exaggerations, over generalizations, balance of presentation
•What is the Perspective – native American, women, etc – does it offer more than one?
•Is there Bias?
•Do images confuse, provoke a reaction or unrelated to text content?

4.Timeliness – when was the page
•Date created
•Date updated

5. Compare /contrast this content on other sites
•Does it fit in with your current understanding?

6. Check the Links
•Forward and Back Links
•Do a Link search: link:thesiteURL

Sources:
Eagleton, M. B., & Dobler, E. (2007). Reading the Web: Strategies for Internet inquiry. New York: The Guilford Press

November, Alan. (2008). Web Literacy for Educators. Thousand Oaks, CA: Corwin Press.

Classroom Models for Evaulation Web Sites

REAL by Web Literacy by Alan November from Web Literacy for Educators

R – Read the URL
E – Examine the content
A – Ask About Author
L – Links

ABC’s by Beth Phillips
A – Author
B – Bias
C – Content
D – Dates
E - Editor

The 4 A's by Yahooligans
1.Accessibility
2.Accuracy
3.Appropriateness
4.Appeal

Seven Steps for Previewing a Web Site by Julie Coiro
1)Read Title
2)Scan Menu Choices
3)Predict where links will go
4)Interactive features
5)Creator
6)Electronic Supports
7)Make judgment to explore


Sources:
Coiro, Julie. (2005, October). Making sense of online text. Educational Leadership, 63(2), 30–35.

Eagleton, M. B., & Dobler, E. (2007). Reading the Web: Strategies for Internet inquiry. New York: The Guilford Press

November, Alan. (2008). Web Literacy for Educators. Thousand Oaks, CA: Corwin Press.

Phillips, Beth & Laureate Education, inc. (2009). A Teacher's Perspective, Evaluation Information Online; Supporting Information Literacy and Online Inquiry in the Classroom.

Yahooligans! Teaching Guide

Monday, May 17, 2010

Searching Effectively

1)Search Engines (http://training.fcps.org/tt1/intsea.htm)

•Use a Search Engine – which searches its databases for your keyword: http://thesearchenginelist.com/

•Use a Directory – which has an organized list based on categories
http://thesearchenginelist.com/directory.html

•Use a MetaSearcher – which searches other search engines
http://searchenginewatch.com/2156241

•Use a Kid centered Search Engine
http://www.ivyjoy.com/rayne/kidssearch.html

•Use a Topic Specific Search – Blog, Video, Podcasts, Google Scholar, or Social Bookmarking Sites

2)Boolean Searches: http://www.lib.berkeley.edu/TeachingLib/Guides/Internet/Boolean.pdf

3)Advanced Searches – Creating a Virtual Index of web pages with the same root domain name

•Host – searches extensions only using the syntax: host:org +Fibonacci
•URL – searches within URL’s using the syntax:
url: k12.us +Fibonacci or
url: lesson +Fibonacci

Saturday, May 8, 2010

Information Literacies

Association of College and Research Libraries (ACRL)

Information literacy is a set of abilities requiring individuals to “recognize
when information is needed and have the ability to locate, evaluate,
and use effectively the needed information.”

Information Literacy Competency Standards for Higher Education

Standard 1 - The information literate student determines the nature and extent of the information needed.

Performance Indicators:
1. The information literate student defines and articulates the need for information.
2. The information literate student identifies a variety of types and formats of potential sources for information.
3. The information literate student considers the costs and benefits of acquiring the needed information.
4. The information literate student reevaluates the nature and extent of the information need.

Standard 2 - The information literate student accesses needed information effectively and efficiently.

Performance Indicators:
1. The information literate student selects the most appropriate investigative methods or information retrieval systems for accessing the needed information.
2. The information literate student constructs and implements effectively designed search strategies.
3. The information literate student retrieves information online or in person using a variety of methods.
4. The information literate student refines the search strategy if necessary.
5. The information literate student extracts, records, and manages the information and its sources.

Standard 3 - The information literate student evaluates information and its sources critically and incorporates selected information into his or her knowledge base and value system.

Performance Indicators:
1. The information literate student summarizes the main ideas to be extracted from the information gathered.
2. The information literate student articulates and applies initial criteria for evaluating both the
information and its sources.
3. The information literate student synthesizes main ideas to construct new concepts.
4. The information literate student compares new knowledge with prior knowledge to determine the value added, contradictions, or other unique characteristics of the information.
5. The information literate student determines whether the new knowledge has an impact on the individual’s value system and takes steps to reconcile differences.
6. The information literate student validates understanding and interpretation of the information through discourse with other individuals, subject-area experts, and/or practitioners.
7. The information literate student determines whether the initial query should be revised.

Standard 4 - The information literate student, individually or as a member of a group, uses information effectively to accomplish a specific purpose.

Performance Indicators:
1. The information literate student applies new and prior information to the planning and creation of a particular product or performance.
2. The information literate student revises the development process for the product or performance.
3. The information literate student communicates the product or performance effectively to others.

Standard 5 - The information literate student understands many of the economic, legal,
and social issues surrounding the use of information and accesses and uses information ethically and legally.


Performance Indicators:
1. The information literate student understands many of the ethical, legal and socio-economic issues surrounding information and information technology.
2. The information literate student follows laws, regulations, institutional policies, and etiquette related
to the access and use of information resources.
3. The information literate student acknowledges the use of information sources in communicating the product or performance.

Saturday, May 1, 2010

Literacy Refined

Definitions of Literacy

•Merriam – Webster: Ability to read and write
•Ability to read, write, communicate
•David Warlick - Using information to accomplish goals
•The United Nations Educational, Scientific and Cultural Organization (UNESCO): "ability to identify, understand, interpret, create, communicate, compute and use printed and written materials associated with varying contexts. Literacy involves a continuum of learning in enabling individuals to achieve their goals, to develop their knowledge and potential, and to participate fully in their community and wider society."
Association of College and Research Libraries (ACRL) - Information literacy is a set of abilities requiring individuals to “recognize when information is needed and have the ability to locate, evaluate, and use effectively the needed information.”

Foundational Literacies
•Alphabet/spelling
•Summarize
•Oral Communications
•Decode words/Phonics
•Response to literature
•Reading fluency
•Comprehension
•Contextual meaning
•Cueing: Graphophonic (Letter/sound relationships), syntax(grammar) and semantic (meaning)
•Transaction: text has no “absolute meaning” depends on readers’ perspective

New Literacies
As defined by The New Literacies Perspective
1.Questioning
2.Searching
3.Evaluating
4.Synthesizing
5.Communication

Multiplicity of Web Literacies
As defined by the New London Group (2000)

1. Media forms
Icons
Colors
Hyperlinks
Animations
Menus/Scroll Bars/Tabs
Audio & podcasts
Video
Images
Charts/Graphs
Pop Up Text
Interactive Graphics
Virtual Realities
Ads (when to ignore)

2.Internet Communications
Search engines
Web pages
Email
List-servs
Discussion groups (asynchronous)
Chat rooms
IM
Video conferencing
Blogs
Wikis
Multi-user games

3.Global Communications
Co-constructing knowledge
Author’s intent (motive behind the message)
Understanding cultural differences (assumptions)
Appropriate content for audience
Digital Citizenship

Based on information from:
Leu, D. J., Kinzer, C. K., Coiro, J. L., & Cammack, D. W. (2004). Toward a theory of new literacies emerging from the internet and other information and communication technologies. In Ruddell, R.B. & Unrau, N.J., (Eds.), Theoretical models and processes of reading (5th ed.). (pp. 1570–1613). Newark, DE: International Reading Association.