Friday, March 25, 2011

Emerging Technology: Online Course Management Systems

Course Management Systems are a framework for an instructor to set up tools to create an online course.

The two popular Course Management Systems are Moodle and Rcampus.


Please visit my Voice Thread to learn more about them.


http://www.voicethread.com/share/1856813/

Nancy Kent

Thursday, February 24, 2011

Reflection Walden Course EDUC 6714: Reaching and Engaging All Learners Through Technology


Image from www.rf123.com

This class started by identifying diversity in the classroom. I thought I would be learning how to reach the diverse learners, the ones on the tails of the normal graph: students on IEP’s and gifted students. Now as I reflect on the course title, I realize I learned two teaching philosophies that are designed to reach all learners, because all learners are unique.

CAST, the Center for Applied Special Technology, has published information on brain research and identifies three brain networks at work during learning. Their Universal Design for Learning (UDL) outlines the What, How and Why of learning to help teachers design units so all students can access their content (Cast, 2007-2009). If you would like additional information, please visit my prezi or CAST’s website at: http://cast.org/udl/index.html.

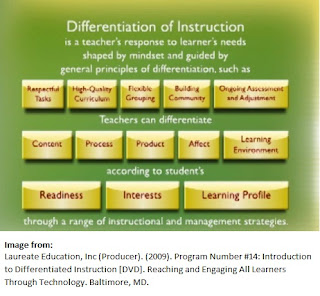
Carol Ann Tomlinson has been a strong advocate for Differentiated Instruction, DI, which is a mindset for teachers that recognize all individuals can learn if teachers recognize each student’s unique learning style and differentiate by content, process and product according to a students’ readiness, interest and learning profile.
In understanding these two initiatives, I realize I have instituted some of these strategies, but there are additional adjustments I need to make to my practice. The first is to more accurately survey my students on their learning profile. How students interpret information is affected by their culture, gender, learning style and dominant intelligence. Knowing these traits about my students will allow both of us to understand the best pathways for content to be understood. I have four online surveys I created at Survey Monkey. Here is a link to one on Multiple Intelligences: http://www.surveymonkey.com/s/V998NQ5.

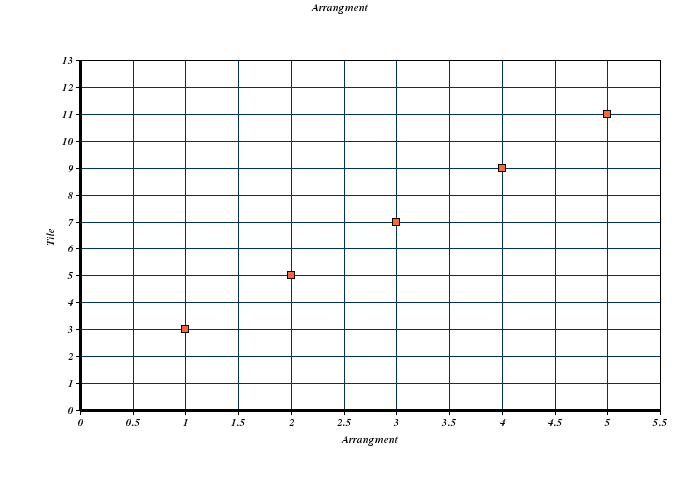
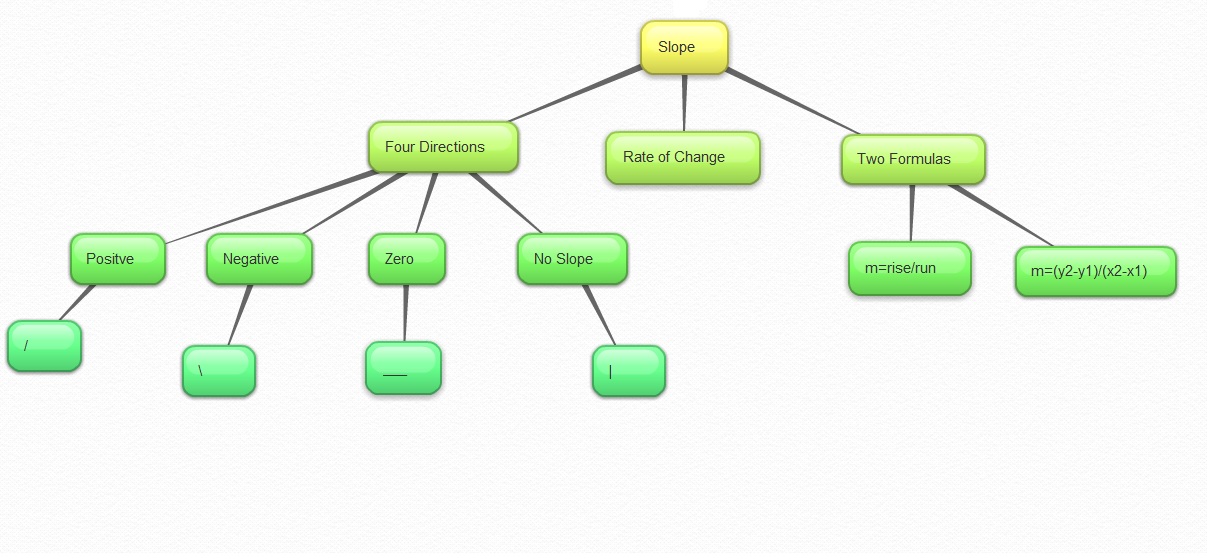
The next area that I need to adjust in my practice is to rethink each unit holistically. I need to identify what each students needs to know, understand and be able to do(Laureate Education, 2009). Right now, each math lesson is taught followed by a practice worksheet. I need to devote more class time allowing students to process the content by having choice board activities based on multiple intelligences, here is my first attempt for a slope lesson:

Differentiation by Product Influenced by Profile / Interest

Verbal/Linguistic: Create a cross word puzzle using at least 15 vocabulary words about slope. You may make one by hand or at Discovery.com (Discovery Education, 2010)

Logical/ Mathematical: Play the slope game and record how many you scored correctly (Quia, 2011)

Musical: Make a song or rap to help us understand the formula or 4 orientations. Sample

Kinesthetic: Using a yard stick, record the rise and run of 3 sets of stair/ramps in our school, calculate the slope of each.

Visual/Spatial: Complete online lesson at:
http://mathforum.org/te/exchange/hosted/miles/exploring_slope_using_an_interactive_applet.pdf (Dendane, 2003 - 2010 )

Naturalist: Research Statistics on your favorite mountain’s elevation and vertical drop and explain how slope is related. Find data like:
http://www.7springs.com/page/category.detail/nav/5010.html(Seven Springs Mountain Resort, 2011)

Intra-Personal: You have been asked to support your client, Ø slope in a discrimination suit; the other three slope orientations have refused to allow him to be present at the Slope Convention.

Inter-Personal: Create a skit with four characters: positive slope, negative slope, zero slope and Ø slope

You will notice five of the choices involve technology: drill and practice with immediate feedback, simulation or research. Technology integration is crucial to allow each student to have unique experiences and to allow them to create artifacts. Free online programs allow teacher many options for helping students make sense of content. Another powerful way to see what your students understand are free online concept mapping tools like https://bubbl.us/ .


As I work my way through my master’s program, Integrating Technology into the Curriculum, at Walden University, I realize it cannot all be done at once. There are changes I need to make to my lessons as I integrate ISTE standards, design inquiry based lessons, and create differentiated activities. I need to research technologies for simulations, drill and practice, and technologies for students to create authentic products such as prezi and/or flip cameras. As I approach each lesson, I need to be thinking “How can I make this content accessible to all?” and “How can technology help?"References

Dendane, A. (2003 - 2010 ). Analyze math. Retrieved February 13, 2011, from Slope of a Line: http://www.analyzemath.com/Slope/Slope.html

Discovery Education. (2010). Discovery Education. Retrieved February 13, 2011 from Classroom Resources - Puzzlemaker: http://puzzlemaker.discoveryeducation.com/CrissCrossSetupForm.asp

McAleer, F. (2011, January 26). Learner's Link. Retrieved February 2, 2011, from Differentiating Instruction: http://www.learnerslink.com/

Laureate Education, Inc (Producer). (2009). Program Number #14: Introduction to Differentiated Instruction [DVD]. Reaching and Engaging All Learners Through Technology. Baltimore, MD.

Quia.(2011). Quia. Retrieved February 13, 2011, from Slope Formula: http://www.quia.com/quiz/248335.html

Seven Springs Mountain Resort. (2011). Seven Springs Mountain Resort. Retrieved February 13, 2011, from Slopes and Trails-Stats:
http://www.7springs.com/page/category.detail/nav/5010.html

Wednesday, December 22, 2010

Final Blog Post EDUC6713

Technology is an ever changing field. Teachers, by definition, support the pursuit of knowledge. Those teachers who are passionate about technology have found an endless source of topics to research. But this research needs to be systematic.

In some of the initial posts, some of my colleagues noted that they keep a list of technologies they plan on researching. I felt bad that I was not that organized. If someone sends me a link or tells me of a new technology, I bookmark it in Delicious, but only get back to it when I think I can incorporate it into practice.

I think in using the ideas from my colleagues and the GAME plan together, I now feel I have the tools to systematically pursue new technologies. I think I need to keep a more organized list of topics to research, align them to the NETS for teachers and rather than researching them at the 11th hour, always have one in the GAME process.

I am pleased with the results of the GAME plan I developed for this course: finding free online tools my students can use from home to help them process data for their 10 journal assignments in my Algebra classes.

I learned that there is no free online tool that duplicates the power of Excel or the Texas Instruments graphing calculators that we have access to in the classroom, but it does appear they may be some on the horizon. MashUp and Microsoft Fuse Labs are already on my GAME list to keep checking on. In the meantime, my students can use two tools to accomplish the task.

Our high school operates on a 4x4 block so I will have new Algebra courses beginning in January. I can immediately educate my students on these new tools so they will have access to data analysis tools in the classroom and at home; giving them the ability to be independent learners.

Monday, December 13, 2010

Using the GAME Plan with Students


The GAME plan is a straightforward systematic approach for
technology goal setting. I believe I could use it effectively with the technology my students need specifically for my course; like analyzing data, but I don’t feel a school can adequately educate the entire population in the ISTE NET-S without administrative leadership

I serve on our district technology committee; we have 3 elementary schools, 1 middle school, 1 high school and 1 vocational school. We have analyzed the ISTE standards, our state standards and organized them into district standards. Our biggest concern was that students coming through our program can have inconsistent exposure to technology. A student might be lucky enough to get teachers who are passionate about technology integration or unlucky and never have the opportunity to use technology. For teachers, it is really an issue of time. As a committee we wanted to organize best practices per grade level put them on a central server so teachers did not have to re-invent the wheel. For example, all fifth graders study the history of our town. We were willing to organize a folder with digital images so all teachers could access it. We were very excited to take on this project!

We went to the Assistant Superintendent/Curriculum Coordinator and she said we had to focus all our attention on our NCLB initiatives in Math and English, and so our project died.

Until a district wide systematic approach is supported by the administration at the top, where a student can create a GAME Plan that spans grade levels organized into an e-portfolio, I feel like I am just contributing to these inconsistencies. Our school needs to embrace the ISTE process and set the essential conditions to educate our students:

http://www.iste.org/standards/nets-for-students/nets-for-students-essential-conditions.aspx


Perhaps when colleges start requesting links to students work, it will get more attention. I do what I can, I try to invite teachers to partner with my class when I am doing a lesson I have created at Walden University, promoting change one teacher at a time. It is usually the first time other teachers have been introduced to the ISTE standards.


To catch a few students, I can start having my students create several GAME plans over my 18 week course. I could present the NET-S to them at the beginning of the course; which most have never seen.

GOAL: For a long term Goal, they could decide how they would like to use technology to complete their 10 journal assignments: learning the graphing calculator, Excel or the free online spreadsheet, Google Dcos, I used for my game plan.

ACTION: They could pursue one choice for two journals.

MONITOR: They could analyze their comfort level, access and results and see if they would like to switch to another method for the next two journals.

EVALUATE: They could evaluate if they are happy with the product they choose.

This would model the process for them. Then when we have a class activity that aligns to a NET-S, they could complete another GAME process.
It is my hope that ISTE will help schools formally develop a process to help schools:

http://nets-implementation.iste.wikispaces.net/

They have a survey online asking what resources teachers think would be helpful:

NETS for Students Development Rubric (by grade)
NETS for Students Assessment Rubric
NETS for Teachers Comprehensive Rubric
NETS Scope and Sequence
NETS Learning Objectives (by grade)
NETS Curriculum Mapping
NETS Observation Check List
Implementation Videos
NETS-aligned Lesson Plans
Rubric for Evaluating Lesson Plans
Peer-reviewed Process for NETS-aligned Lesson Plans
Content-area Experts to Infuse NETS
NETS Toolkit for District Use
Database of NETS-Aligned Activities

I look forward to when they are available!

Tuesday, December 7, 2010

Results of GAME Plan – Piecing it Together


After an exhaustive search, I am now ready to recommend the best tools for my students to help complete their data analysis for their journal questions if they do not have Excel at home. It requires piecing together two tools. This is meant to be a step by step tutorial to create and print graphs for my student; please click on each image to enlarge.


The first tool, Google Docs: docs.google.com

I selected Google Docs because it does not require any downloads to the student’s home computer; all you need is a Google Account.


To analyze data: Go to Create New Spreadsheet

X   Y
1    5
2    9
3   13
4   17

Steps
1) Enter data and select the data (it will turn blue)
2) On toolbar, select Insert Chart
3) In CHARTS - Choose Scatter AND click on the graph image
4) Select INSERT button on the lower right.


5) But this will embed the graph in your data. Use the pull down menu to move it to its own sheet


6) Go to Edit Chart to add titles and labels
7) Add a title
8) Add a label for the Vertical Axis and Change Min and Max if necessary
9) Switch to the Horizontal Axis and repeat
10) Choose Update when complete


PRINTING
Now it would seem that printing would be easy….but
11) Using FILE print produces a blank page
12) Publishing gives you a URL to embed on a web page
13) Save Image is a Quick Time File


14) Instead right click in the graph area and SELECT ALL


15) Right click again when all is blue and Select Print Preview


16) At this point, you will be in the browsers’ menu. Set the orientation to Landscape if necessary
17) Select the print icon


Your Graph:


TRENDLINEAt this point you have a beautiful graph printed on its own page complete with title and labels. But you have not been able to find the equation of the line.

The second tool: A Simple Regression Utility at

http://people.hofstra.edu/Stefan_Waner/RealWorld/newgraph/regressionframes.html

by Stefan Waner and Steven Costenoble from Hofstra University.

18) Re-enter the data


19) Select the appropriate type of regression

20) Find the Trendline here


There you have it, in 20 easy steps!

I have learned that there is no single free online tool to accomplish the task we can in the computer lab. My goal now will be to continue to research until I can find a more streamline free approach.

My new learning goals will be explore the web site:

http://nets-implementation.iste.wikispaces.net/

to have a more systematic approach to linking all the NETS in my curriculum and to try and find a free online course management systems like Moodle to use with my spring semester computer programming course. I plan on using the GAME plan again and have already started my KWL chart.

Monday, November 29, 2010

Evaluating GAME Progress

Royalty Free Image from www.123rf.com

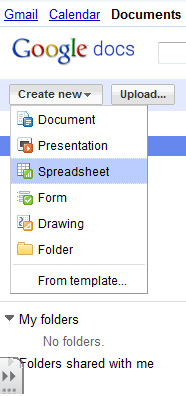
This week I finished reviewing my last 5 free online spreadsheets. EXpressoCorp was no longer available for new accounts as it will soon be integrated into Lotus Live, which will be a subscription service. InputWebWizard is not free, Peepel looks promising, but will not open. Sheetster was very buggy, the graph window appeared, but did not contain the graph. SimpleSpreadsheet only offered source code. Now I have reached my 20th spreadsheet to evaluate: ThinkFree. Despite its name, ThinkFree is not free. It is still in beta and may be one to watch as it has many of the features I am looking for based on my free 30 day trial evaluation.

My conclusion, at present there is no free online spreadsheet that can rival Excel or the Texas Instruments Graphing Calculator for data analysis.

I am not giving up. It appears there are many online applications in beta like MashUp and Microsoft Fuse Labs which is designed to share Docs on Facebook

http://docs.com/

that may be available soon.

For my refocused GAME plan:

1) Locate a web based graphing program or calculator that can print professional looking full page graphs. I researched all graphing tools at Cool Tools for Schools

http://cooltoolsforschools.wikispaces.com/Graphing+Tools

and found two can make nice xyscatter: ChartTool and ChartGizmo, but they only have auto scaling and will not connect the ordered pairs.


2) Locate a web based site that will calculate the 5 types of regression equation my students are expected to perform. The best one I have found so far is at:

http://people.hofstra.edu/Stefan_Waner/RealWorld/newgraph/regressionframes.html

Still searching…..In the “Looking for a Needle in the Haystack” division, I also searched and downloaded multiple freeware and shareware products: MATHGV4, SPR, Kalkulator, Statiscope, SHAZAM, Graph-Free Graph Plotting Software, Sagata Regression Pro 1, and ZGrapher 1.4

and located more (unusable) online options:

http://www.mathcracker.com/scatter_plot.php
http://www.socr.ucla.edu/htmls/SOCR_Charts.html
http://www.statcrunch.com/5.0/googlemap.php
http://www.swivel.com/
http://www.wessa.net/slr.wasp
http://web2.0calc.com/

I did find www.calculator.com has a statistics view coming soon – another technology to watch.

Late to this entry, I have discovered Google Just announced new tools new Chart tools which I will investigate next week.

http://www.freetech4teachers.com/2010/10/new-visualization-charts-in-google-docs.html

Tuesday, November 23, 2010

Monitoring the GAME Plan


I use a Texas Instruments Graphing Calculator and Excel in my classroom. In my game plan, I want to find a comparative free data analysis tool for my students to use at home for 5 types of regression. I have finished compiling a list of 20 free online spreadsheets and began to evaluate the features my students would need.


Royalty Free Image from www.123rf.com

For each, I created a free account and copied in 5 data sets. I used the help features to learn how to create an xyscatter graph for each and then looked for the 5 corresponding trendlines. If there was no trendline option, I looked for built in functions. Then I looked at the quality of the graph and how it would look printed. Could it be enlarged and printed on its own page or did it have to be on top of the data within the sheet? I finally looked for export options.

After evaluating 15 online spreadsheets I have found 8 were not going to be useful. They were either no longer available or only offered the source code to be downloaded. The user would have to compile it and this is far too complicated for my target audience. The other 7 sites had varying useful features (see matrix below), but none that exactly duplicated the abilities of the tools we use in class.

Here is my evaluation matrix so far:


I was most disappointed with Office Live. It does not have any of the Trendline features that Excel does, lagging far behind even Open Office which can at least do linear and exponential trendlines. I did learn Microsoft is going to be releasing a based web application called Microsoft Cloud Office 365, but was again disappointed that will be subscription based.

I still have 5 more to evaluate, but I fear the more obscure they are, the less likely they will have multiple features. They are eXpressoCorp, InputWebWizard, Peepel, Sheetster, SimpleSpreadsheet and ThinkFree.

I do not feel I am finding the information and resources I need.

I do feel I need to modify my GAME plan.

My new focus will be a two part search:

1) To locate a web based graphing programs or calculators that can print professional looking full page graphs. I have found a good starting point for researching graphing tools:

http://cooltoolsforschools.wikispaces.com/Graphing+Tools

2) To locate a web based site that will calculate the 5 types of regression equation my students are expected to perform. I have found two so far:

http://people.hofstra.edu/Stefan_Waner/RealWorld/newgraph/regressionframes.html

http://www.xuru.org/rt/TOC.asp
and will continue searching site from:

http://statpages.org/#Calculators