After an exhaustive search, I am now ready to recommend the best tools for my students to help complete their data analysis for their journal questions if they do not have Excel at home. It requires piecing together two tools. This is meant to be a step by step tutorial to create and print graphs for my student; please click on each image to enlarge.

The first tool, Google Docs: docs.google.com
I selected Google Docs because it does not require any downloads to the student’s home computer; all you need is a Google Account.
To analyze data: Go to Create New Spreadsheet
X Y
1 5
2 9
3 13
4 17

Steps
1) Enter data and select the data (it will turn blue)
2) On toolbar, select Insert Chart
3) In CHARTS - Choose Scatter AND click on the graph image
4) Select INSERT button on the lower right.

5) But this will embed the graph in your data. Use the pull down menu to move it to its own sheet

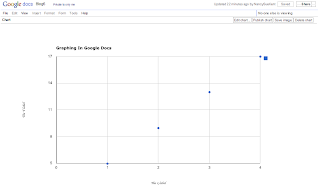
6) Go to Edit Chart to add titles and labels
7) Add a title
8) Add a label for the Vertical Axis and Change Min and Max if necessary
9) Switch to the Horizontal Axis and repeat
10) Choose Update when complete

PRINTING
Now it would seem that printing would be easy….but
11) Using FILE print produces a blank page
12) Publishing gives you a URL to embed on a web page
13) Save Image is a Quick Time File

14) Instead right click in the graph area and SELECT ALL

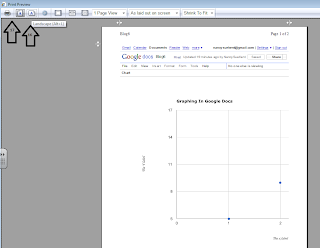
15) Right click again when all is blue and Select Print Preview

16) At this point, you will be in the browsers’ menu. Set the orientation to Landscape if necessary
17) Select the print icon

Your Graph:

TRENDLINEAt this point you have a beautiful graph printed on its own page complete with title and labels. But you have not been able to find the equation of the line.
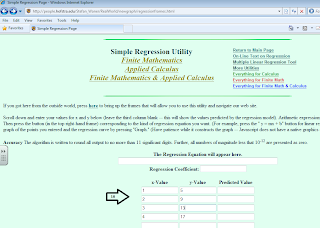
The second tool: A Simple Regression Utility at
http://people.hofstra.edu/Stefan_Waner/RealWorld/newgraph/regressionframes.html
by Stefan Waner and Steven Costenoble from Hofstra University.
18) Re-enter the data

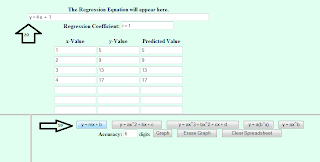
19) Select the appropriate type of regression
20) Find the Trendline here

There you have it, in 20 easy steps!
I have learned that there is no single free online tool to accomplish the task we can in the computer lab. My goal now will be to continue to research until I can find a more streamline free approach.
My new learning goals will be explore the web site:
http://nets-implementation.iste.wikispaces.net/
to have a more systematic approach to linking all the NETS in my curriculum and to try and find a free online course management systems like Moodle to use with my spring semester computer programming course. I plan on using the GAME plan again and have already started my KWL chart.


Nancy,
ReplyDeleteYou have put in a lot of hard work and have done an incredible job! Thanks for sharing your findings. We need to keep in touch even after this class. You have truly been a huge help to me. You are such a wonderful asset to your students!
Lisa
I would love to stay in touch - are you taking the next Walden course? I am going to finish the next two in a row - so excited to complete this program!
ReplyDeleteNancy,
ReplyDeleteI have to agree that it looks like you have put a lot of work into this! This is great information, and it will help your (and your students) tremendously. I hope you find a free web tool that will wrok magic for you and your students. I have found that so many web tools work together--Glogster and Wikispaces have paired up. I'm sure that you'll find something that works for you. There certainly is an infinite amount of information out there!
Nancy,
ReplyDeleteGreat job! Google Docs looks like a great program for scatter plots and printing! I am excited to try it out in my own classroom. Thanks for all of your hard work. I know it will pay off in the classroom for your students!
Sally Moore